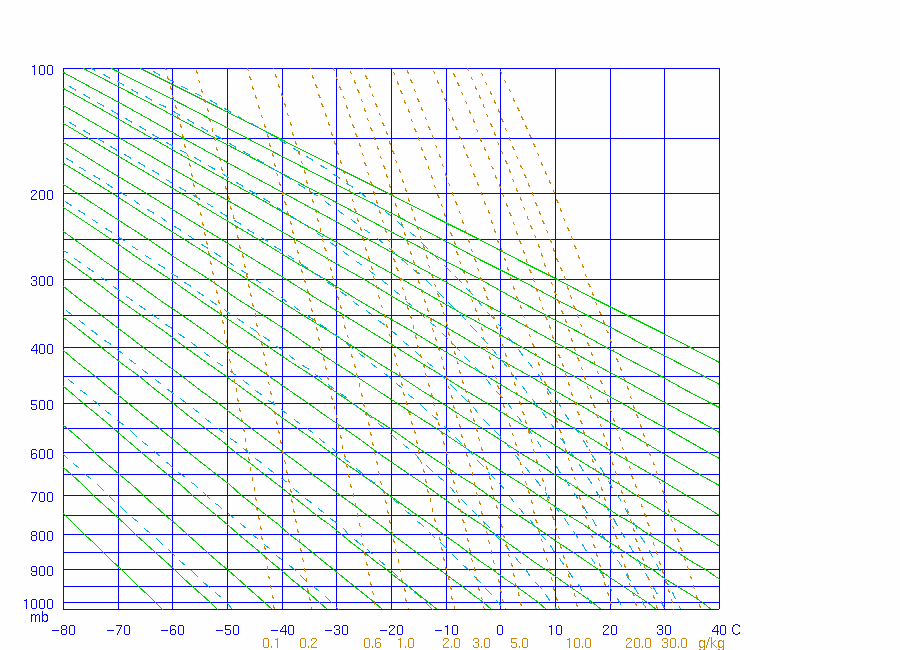
Stüve diagram
Encyclopedia

Thermodynamic diagrams
Thermodynamic diagrams are diagrams used by scientists and engineers to represent the thermodynamic states of a material and the consequences of manipulating this material...
commonly used in weather
Weather
Weather is the state of the atmosphere, to the degree that it is hot or cold, wet or dry, calm or stormy, clear or cloudy. Most weather phenomena occur in the troposphere, just below the stratosphere. Weather refers, generally, to day-to-day temperature and precipitation activity, whereas climate...
analysis and forecasting. Usually, temperature
Temperature
Temperature is a physical property of matter that quantitatively expresses the common notions of hot and cold. Objects of low temperature are cold, while various degrees of higher temperatures are referred to as warm or hot...
and dew point
Dew point
The dew point is the temperature to which a given parcel of humid air must be cooled, at constant barometric pressure, for water vapor to condense into liquid water. The condensed water is called dew when it forms on a solid surface. The dew point is a saturation temperature.The dew point is...
data from radiosonde
Radiosonde
A radiosonde is a unit for use in weather balloons that measures various atmospheric parameters and transmits them to a fixed receiver. Radiosondes may operate at a radio frequency of 403 MHz or 1680 MHz and both types may be adjusted slightly higher or lower as required...
s are plotted on these diagrams to allow calculations of convective stability or Convective Available Potential Energy
Convective available potential energy
In meteorology, convective available potential energy , sometimes, simply, available potential energy , is the amount of energy a parcel of air would have if lifted a certain distance vertically through the atmosphere...
. Wind barbs are often plotted at the side of the diagram to indicate the winds at different heights.
The Stüve diagram was developed circa 1927 by Georg Stüve (1888-1935) and quickly gained widespread acceptance in the United States. It has a simplicity in that it uses straight lines for the three primary variables: pressure
Pressure
Pressure is the force per unit area applied in a direction perpendicular to the surface of an object. Gauge pressure is the pressure relative to the local atmospheric or ambient pressure.- Definition :...
, temperature
Temperature
Temperature is a physical property of matter that quantitatively expresses the common notions of hot and cold. Objects of low temperature are cold, while various degrees of higher temperatures are referred to as warm or hot...
and potential temperature. In doing so, however, it sacrifices the equal-area requirements (from the original Clausius-Clapeyron relation
Clausius-Clapeyron relation
The Clausius–Clapeyron relation, named after Rudolf Clausius and Benoît Paul Émile Clapeyron, who defined it sometime after 1834, is a way of characterizing a discontinuous phase transition between two phases of matter. On a pressure–temperature diagram, the line separating the two phases is known...
) that are satisfied in two of the other two diagrams (Skew-T and Tephigram
Tephigram
A tephigram is one of four thermodynamic diagrams commonly used in weather analysis and forecasting. The name evolved from the original name "T-\phi-gram" to describe the axes of temperature and entropy used to create the plot...
). For practical purposes, this is not important. In the Stüve diagram, isotherms are straight and vertical, isobars are straight and horizontal and dry adiabats are also straight and have a 45 degree inclination to the left while moist adiabats are curved.

