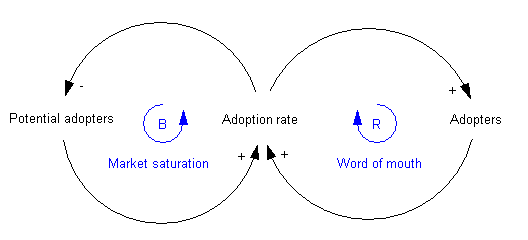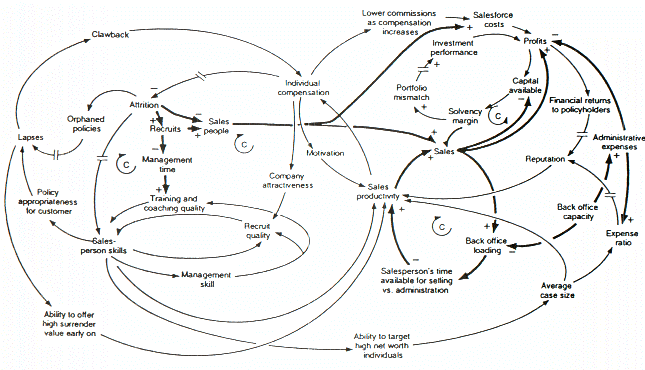
Causal loop diagram
Encyclopedia
A causal loop diagram is a causal diagram
that aids in visualizing how interrelated variables
affect one another. The diagram consists of a set of nodes
representing the variables connected together. The relationships between these variables, represented by arrows, can be labelled as positive or negative.
Example of positive reinforcing loop:
The amount of the Bank Balance will affect the amount of the Earned Interest, as represented by the top blue arrow, pointing from Bank Balance to Earned Interest.
Since an increase in Bank balance results in an increase in Earned Interest, this link is positive, which is denoted with a ""+"".
The Earned interest gets added to the Bank balance, also a positive link, represented by the bottom blue arrow.
The causal effect between these nodes forms a positive reinforcing loop, represented by the green arrow, which is denoted with an "R".
Or to put it in other words:
Identifying reinforcing and balancing loops is an important step for identifying Reference Behaviour Patterns, i.e. possible dynamic behaviours of the system.
If the system has delays (often denoted by drawing a short line across the causal link), the system might fluctuate.


Causal diagram
A causal diagram is a graphical tool that enables the visualisation of causal relationships between variables in a causal model. A typical causal diagram will comprise a set of variables defined as being within the scope of the model being represented...
that aids in visualizing how interrelated variables
Variable (programming)
In computer programming, a variable is a symbolic name given to some known or unknown quantity or information, for the purpose of allowing the name to be used independently of the information it represents...
affect one another. The diagram consists of a set of nodes
Node (computer science)
A node is a record consisting of one or more fields that are links to other nodes, and a data field. The link and data fields are often implemented by pointers or references although it is also quite common for the data to be embedded directly in the node. Nodes are used to build linked, often...
representing the variables connected together. The relationships between these variables, represented by arrows, can be labelled as positive or negative.
Example of positive reinforcing loop:
The amount of the Bank Balance will affect the amount of the Earned Interest, as represented by the top blue arrow, pointing from Bank Balance to Earned Interest.
Since an increase in Bank balance results in an increase in Earned Interest, this link is positive, which is denoted with a ""+"".
The Earned interest gets added to the Bank balance, also a positive link, represented by the bottom blue arrow.
The causal effect between these nodes forms a positive reinforcing loop, represented by the green arrow, which is denoted with an "R".
Positive and negative causal links
- Positive causal link means that the two nodes change in the same direction, i.e. if the node in which the link starts decreases, the other node also decreases. Similarly, if the node in which the link starts increases, the other node increases.
- Negative causal link means that the two nodes change in opposite directions, i.e. if the node in which the link starts increases, then the other node decreases, and vice versa.
Example
Reinforcing and balancing loops
To determine if a causal loop is reinforcing or balancing, one can start with an assumption, e.g. "Node 1 increases" and follow the loop around. The loop is:- reinforcing if, after going around the loop, one ends up with the same result as the initial assumption.
- balancing if the result contradicts the initial assumption.
Or to put it in other words:
- reinforcing loops have an even number of negative links (zero also is even, see example above)
- balancing loops have an uneven number of negative links.
Identifying reinforcing and balancing loops is an important step for identifying Reference Behaviour Patterns, i.e. possible dynamic behaviours of the system.
- Reinforcing loops are associated with exponential increases/decreases.
- Balancing loops are associated with reaching a plateau.
If the system has delays (often denoted by drawing a short line across the causal link), the system might fluctuate.
Example


External links
- WikiSD the System Dynamics Society Wiki

