Chartjunk
Encyclopedia

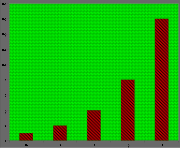
Markings and visual elements can be called chartjunk if they are not part of the minimum set of visuals necessary to communicate the information understandably. Examples of unnecessary elements which might be called chartjunk include heavy or dark grid lines, unnecessary text or inappropriately complex fontfaces, ornamented chart axes and display frames, pictures or icons within data graphs, ornamental shading and unnecessary dimensions.
Another kind of chartjunk skews the depiction and makes it difficult to understand the real data being displayed. Examples of this type include items depicted out of scale to one another, noisy backgrounds making comparison between elements difficult in a chart or graph, and 3-D simulations in line and bar charts.

Edward Tufte
Edward Rolf Tufte is an American statistician and professor emeritus of political science, statistics, and computer science at Yale University. He is noted for his writings on information design and as a pioneer in the field of data visualization....
in his 1983 book The Visual Display of Quantitative Information. Tufte wrote:
The term being relatively recent, it is still often associated with Tufte's name.
The concept is analogous to Adolf Loos's
Adolf Loos
Adolf Franz Karl Viktor Maria Loos was a Moravian-born Austro-Hungarian architect. He was influential in European Modern architecture, and in his essay Ornament and Crime he repudiated the florid style of the Vienna Secession, the Austrian version of Art Nouveau...
idea that ornament is a crime
Ornament and Crime
Ornament and Crime is an essay written in 1908 by the influential and self-consciously "modern" Austrian architect Adolf Loos under the German title Ornament und Verbrechen...
.
On the psychological side, it is related to the number of objects an average human can hold in working memory, which is 7 ± 2
The Magical Number Seven, Plus or Minus Two
"The Magical Number Seven, Plus or Minus Two: Some Limits on Our Capacity for Processing Information" is one of the most highly cited papers in psychology. It was published in 1956 by the cognitive psychologist George A. Miller of Princeton University's Department of Psychology in Psychological...
, according to G.A. Miller (1956). The span of immediate memory and span of absolute judgment imposes severe limitations on the amount of information that humans are able to receive, process and remember; it is necessary to select and focus on key information.

