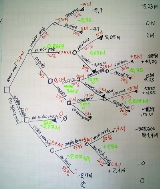
Decision tree
Overview
Diagram
A diagram is a two-dimensional geometric symbolic representation of information according to some visualization technique. Sometimes, the technique uses a three-dimensional visualization which is then projected onto the two-dimensional surface...
or model
Causal model
A causal model is an abstract model that describes the causal mechanisms of a system. The model must express more than correlation because correlation does not imply causation....
of decisions and their possible consequences, including chance
Probability
Probability is ordinarily used to describe an attitude of mind towards some proposition of whose truth we arenot certain. The proposition of interest is usually of the form "Will a specific event occur?" The attitude of mind is of the form "How certain are we that the event will occur?" The...
event outcomes, resource costs, and utility
Utility
In economics, utility is a measure of customer satisfaction, referring to the total satisfaction received by a consumer from consuming a good or service....
. It is one way to display an algorithm
Algorithm
In mathematics and computer science, an algorithm is an effective method expressed as a finite list of well-defined instructions for calculating a function. Algorithms are used for calculation, data processing, and automated reasoning...
. Decision trees are commonly used in operations research
Operations research
Operations research is an interdisciplinary mathematical science that focuses on the effective use of technology by organizations...
, specifically in decision analysis
Decision analysis
Decision analysis is the discipline comprising the philosophy, theory, methodology, and professional practice necessary to address important decisions in a formal manner...
, to help identify a strategy most likely to reach a goal. Another use of decision trees is as a descriptive means for calculating conditional probabilities
Conditional probability
In probability theory, the "conditional probability of A given B" is the probability of A if B is known to occur. It is commonly notated P, and sometimes P_B. P can be visualised as the probability of event A when the sample space is restricted to event B...
.
In decision analysis
Decision analysis
Decision analysis is the discipline comprising the philosophy, theory, methodology, and professional practice necessary to address important decisions in a formal manner...
, a "decision tree" — and the closely related influence diagram
Influence diagram
An influence diagram is a compact graphical and mathematical representation of a decision situation...
— is used as a visual and analytical decision support tool, where the expected value
Expected value
In probability theory, the expected value of a random variable is the weighted average of all possible values that this random variable can take on...
s (or expected utility) of competing alternatives are calculated.
A decision tree consists of 3 types of nodes:-
1.

