
Fundamental modeling concepts
Encyclopedia
Fundamental Modeling Concepts (FMC) provide a framework to describe software-intensive systems. It strongly emphasizes the communication about software-intensive systems by using a semi-formal
graphical notation that can easily be understood.
FMC defines a dedicated diagram type for each perspective. FMC diagrams use a simple and lean notation. The purpose of FMC diagrams is to facilitate the communication about a software system, not only between technical experts but also between technical experts and business or domain experts. The comprehensibility of FMC diagrams has made them famous among its supporters.
The common approach when working with FMC is to start with a high-level diagram of the compositional structure of a system. This “big picture” diagram serves as a reference in the communication with all involved stakeholders of the project. Later on, the high-level diagram is iteratively refined to model technical details of the system. Complementary diagrams for processes observed in the system or value domains found in the system are introduced as needed.
All FMC diagrams are bipartite graphs. Each Bipartite graph
consists of two disjoint sets of vertices with the condition that no vertex
is connected to another vertex of the same set. In FMC diagrams, members of one set are represented by angular shapes, and members of the other set are represented by curved shapes. Each element in an FMC diagram can be refined by another diagram of the same type, provided that the combined graph is also bipartite. This mechanism allows modeling all relevant layers of abstraction with the same notation.
 Compositional structure diagrams depict the static structure of a system, and the relationships between system components. System components can be active or passive. Agents are active system components. They perform activities in the system. Storages and channels are passive components which store or transmit information.
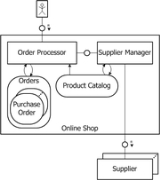
The image to the right is an example of a compositional structure diagram. It contains the agents Order Processor, Supplier Manager, Supplier, Online Shop and an unnamed human agent. Agents are represented by rectangles. The dots and the shadow of the agent Supplier indicate that this agent has multiple instances, i.e. the Supplier Manager communicates with one or many suppliers. The so called human agent represents a user interacting with the system.
The diagram contains the storages Orders, Purchase Order and Product Catalog. Storages are represented by curved shapes. Agents can read from storages, write to storages or modify the content of storages. The directions of the arrows indicate which operation is performed by an agent. In the diagram, the Supplier Manager can modify the content of the Product Catalog, whereas the Order Processor can only read the content of the Product Catalog.
Agents communicate via channels. The direction of information flow is either indicated by arrows (not shown in the picture), by a request-response-symbol (e.g. between Supplier Manager and Supplier) or omitted (e.g. between Order Processor and Supplier Manager).
s.
.
Semi-formal
In Western clothing semi-formal is a grouping of dress codes, indicating the sort of clothes worn to events with a level of protocol between informal and formal...
graphical notation that can easily be understood.
Introduction
FMC distinguishes three perspectives to look at a software system:- Structure of the system
- Processes in the system
- Value domains of the system
FMC defines a dedicated diagram type for each perspective. FMC diagrams use a simple and lean notation. The purpose of FMC diagrams is to facilitate the communication about a software system, not only between technical experts but also between technical experts and business or domain experts. The comprehensibility of FMC diagrams has made them famous among its supporters.
The common approach when working with FMC is to start with a high-level diagram of the compositional structure of a system. This “big picture” diagram serves as a reference in the communication with all involved stakeholders of the project. Later on, the high-level diagram is iteratively refined to model technical details of the system. Complementary diagrams for processes observed in the system or value domains found in the system are introduced as needed.
Diagram Types
FMC uses three diagram types to model different aspects of a system:- Compositional Structure Diagram depicts the static structure of a system. This diagram type is also known as FMC Block Diagram
- Dynamic Structure Diagram depicts processes that can be observed in a system. This diagram type is also known as FMC Petri-net
- Value Range Structure Diagram depicts structures of values found in the system. This diagram type is also known as FMC E/R Diagram
All FMC diagrams are bipartite graphs. Each Bipartite graph
Bipartite graph
In the mathematical field of graph theory, a bipartite graph is a graph whose vertices can be divided into two disjoint sets U and V such that every edge connects a vertex in U to one in V; that is, U and V are independent sets...
consists of two disjoint sets of vertices with the condition that no vertex
Vertex (graph theory)
In graph theory, a vertex or node is the fundamental unit out of which graphs are formed: an undirected graph consists of a set of vertices and a set of edges , while a directed graph consists of a set of vertices and a set of arcs...
is connected to another vertex of the same set. In FMC diagrams, members of one set are represented by angular shapes, and members of the other set are represented by curved shapes. Each element in an FMC diagram can be refined by another diagram of the same type, provided that the combined graph is also bipartite. This mechanism allows modeling all relevant layers of abstraction with the same notation.
Compositional Structure Diagram
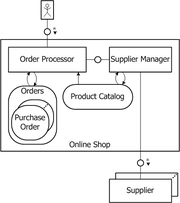
The image to the right is an example of a compositional structure diagram. It contains the agents Order Processor, Supplier Manager, Supplier, Online Shop and an unnamed human agent. Agents are represented by rectangles. The dots and the shadow of the agent Supplier indicate that this agent has multiple instances, i.e. the Supplier Manager communicates with one or many suppliers. The so called human agent represents a user interacting with the system.
The diagram contains the storages Orders, Purchase Order and Product Catalog. Storages are represented by curved shapes. Agents can read from storages, write to storages or modify the content of storages. The directions of the arrows indicate which operation is performed by an agent. In the diagram, the Supplier Manager can modify the content of the Product Catalog, whereas the Order Processor can only read the content of the Product Catalog.
Agents communicate via channels. The direction of information flow is either indicated by arrows (not shown in the picture), by a request-response-symbol (e.g. between Supplier Manager and Supplier) or omitted (e.g. between Order Processor and Supplier Manager).
Dynamic Structure Diagram
Dynamic structures are derived from petri netPetri net
A Petri net is one of several mathematical modeling languages for the description of distributed systems. A Petri net is a directed bipartite graph, in which the nodes represent transitions and places...
s.
- "They are used to express system behavior over time, depicting the actions performed by the agents. So they clarify how a system is working and how communication takes place between different agents."
Value Range Structure Diagram
Value range structure diagrams (also known as FMC Entity Relationship Diagrams) can be compared with the Entity-relationship modelEntity-relationship model
In software engineering, an entity-relationship model is an abstract and conceptual representation of data. Entity-relationship modeling is a database modeling method, used to produce a type of conceptual schema or semantic data model of a system, often a relational database, and its requirements...
.
- "[They] are used to depict value range structures or topics as mathematical structures. Value range structures describe observable values at locations within the system whereas topic diagrams allow a much wider usage in order to cover all correlations between interesting points."