List of countries by oil production
Encyclopedia
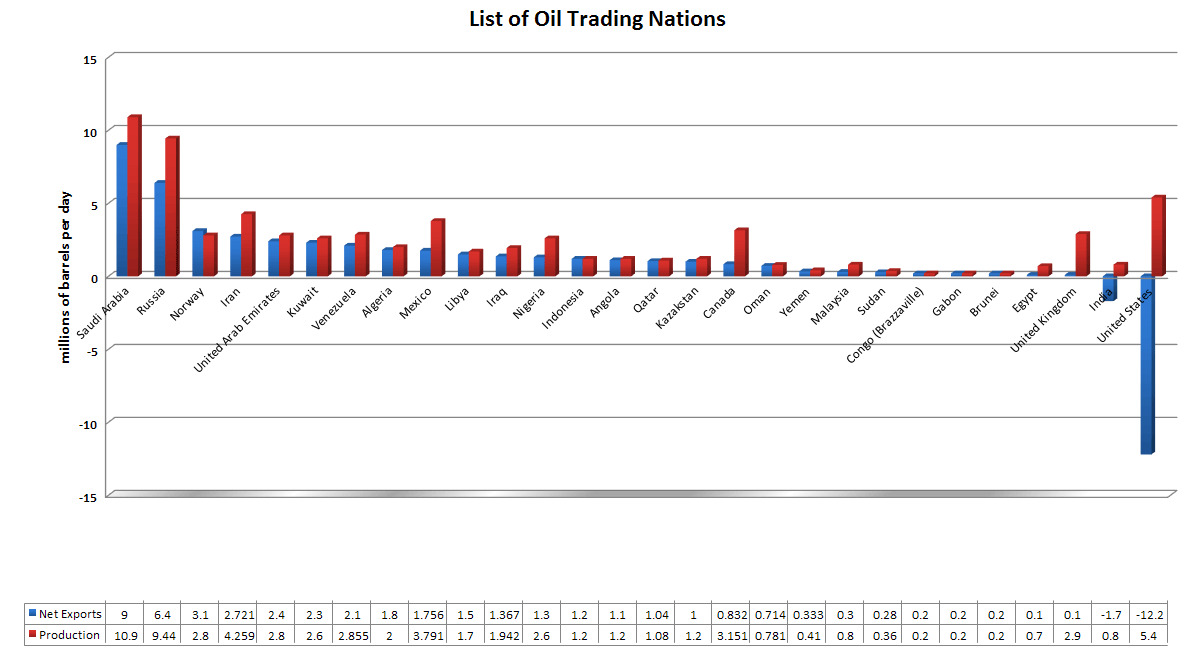
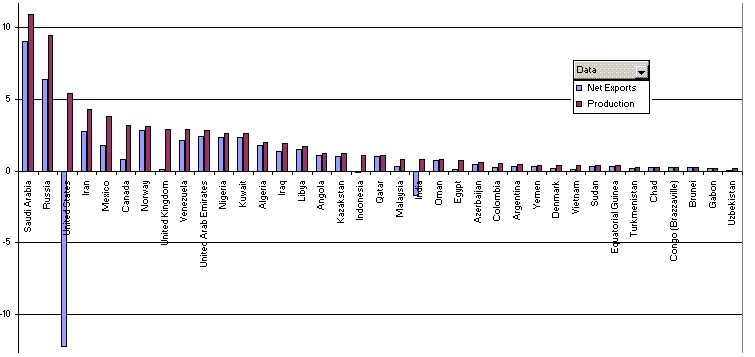
This is a list of countries by oil
production
mostly based on CIA World Factbook data.
Note that oil production refers to the sum of barrels of crude oil extracted each day from drilling operations compounded with the equivalent production of natural gas liquids and refinery gains from domestic or imported petroleum production. This should not be confused with oil supply, which often refers to market availability of multiple types of petroleum and non-petroleum fuels (such as natural gas
and bio-ethanol), as well as refinery gains and extraction from man-made reserves of different petroleum products (such as the US strategic reserves).


Petroleum
Petroleum or crude oil is a naturally occurring, flammable liquid consisting of a complex mixture of hydrocarbons of various molecular weights and other liquid organic compounds, that are found in geologic formations beneath the Earth's surface. Petroleum is recovered mostly through oil drilling...
production
Economics
Economics is the social science that analyzes the production, distribution, and consumption of goods and services. The term economics comes from the Ancient Greek from + , hence "rules of the house"...
mostly based on CIA World Factbook data.
Note that oil production refers to the sum of barrels of crude oil extracted each day from drilling operations compounded with the equivalent production of natural gas liquids and refinery gains from domestic or imported petroleum production. This should not be confused with oil supply, which often refers to market availability of multiple types of petroleum and non-petroleum fuels (such as natural gas
Natural gas
Natural gas is a naturally occurring gas mixture consisting primarily of methane, typically with 0–20% higher hydrocarbons . It is found associated with other hydrocarbon fuel, in coal beds, as methane clathrates, and is an important fuel source and a major feedstock for fertilizers.Most natural...
and bio-ethanol), as well as refinery gains and extraction from man-made reserves of different petroleum products (such as the US strategic reserves).


| Country | Share of World % | Date of Information |
||
|---|---|---|---|---|
| — | World | 87,500,000 | 100% | 2011 |
| — |  Arab League Arab League |
24,171,503 | 29.71% | 2009 |
| 1 |  Russia Russia |
10,540,000 | 12.01% | 2011 |
| 2 |  Saudi Arabia Saudi Arabia |
8,800,000 | 11.59% | 2011 |
| 3 |  United States United States |
7,800,000 | 10.75% | 2011 |
| 4 |  Iran Iran |
4,172,000 | 4.95% | 2009 |
| 5 |  Mainland China Mainland China |
3,991,000 | 4.74% | 2009 |
| 6 |  Canada Canada |
3,289,000 | 3.90% | 2009 |
| 7 |  Mexico Mexico |
3,001,000 | 3.56% | 2009 |
| 8 |  United Arab Emirates United Arab Emirates |
2,798,000 | 3.32% | 2009 |
| 9 |  Brazil Brazil |
2,572,000 | 3.05% | 2009 |
| 10 |  Kuwait Kuwait |
2,494,000 | 2.96% | 2009 |
| 11 |  Venezuela Venezuela |
2,472,000 | 2.93% | 2009 |
| 12 |  Iraq Iraq |
2,399,000 | 2.85% | 2009 |
| — |  European Union European Union |
2,365,000 | 2.81% | 2009 |
| 13 |  Norway Norway |
2,350,000 | 2.79% | 2009 |
| 14 |  Nigeria Nigeria |
2,211,000 | 2.62% | 2009 |
| 15 |  Algeria Algeria |
2,125,000 | 2.52% | 2009 |
| 16 |  Angola Angola |
1,948,000 | 2.31% | 2009 |
| 17 |  Libya Libya |
1,790,000 | 2.12% | 2009 |
| 18 |  Kazakhstan Kazakhstan |
1,540,000 | 1.83% | 2009 |
| 19 |  United Kingdom United Kingdom |
1,502,000 | 1.78% | 2009 |
| 20 |  Qatar Qatar |
1,213,000 | 1.44% | 2009 |
| 21 |  Indonesia Indonesia |
1,023,000 | 1.21% | 2009 |
| 22 |  Azerbaijan Azerbaijan |
1,011,000 | 1.20% | 2009 |
| 23 |  Colombia Colombia |
903,000 | 0.97% | 2011 |
| 24 |  India India |
878,700 | 1.04% | 2009 |
| 25 |  Oman Oman |
816,000 | 0.95% | 2009 |
| 26 |  Argentina Argentina |
796,300 | 0.93% | 2009 |
| 27 |  Malaysia Malaysia |
693,700 | 0.82% | 2009 |
| 28 |  Egypt Egypt |
680,500 | 0.81% | 2009 |
| 29 |  Australia Australia |
589,200 | 0.70% | 2009 |
| 30 |  Ecuador Ecuador |
485,700 | 0.58% | 2009 |
| 31 |  Syria Syria |
400,400 | 0.48% | 2009 |
| 32 |  Thailand Thailand |
380,000 | 0.45% | 2010 |
| 33 | align="left" | | 375,000 | 0.45% | 2010 |
| 34 |  Equatorial Guinea Equatorial Guinea |
346,000 | 0.41% | 2009 |
| 35 |  Vietnam Vietnam |
300,600 | 0.36% | 2010 |
| 36 |  Yemen Yemen |
288,400 | 0.34% | 2009 |
| 37 |  Republic of China Republic of China |
276,800 | 0.33% | 2009 |
| 38 |  Republic of the Congo Republic of the Congo |
274,400 | 0.33% | 2009 |
| 39 |  Denmark Denmark |
262,100 | 0.31% | 2009 |
| 40 |  Gabon Gabon |
241,700 | 0.29% | 2009 |
| 41 |  Turkmenistan Turkmenistan |
197,700 | 0.23% | 2009 |
| 42 |  South Africa South Africa |
191,000 | 0.23% | 2009 |
| 43 |  Germany Germany |
156,800 | 0.19% | 2009 |
| 44 |  Trinidad and Tobago Trinidad and Tobago |
151,600 | 0.18% | 2009 |
| 45 |  Peru Peru |
148,000 | 0.18% | 2009 |
| 46 |  Italy Italy |
146,500 | 0.17% | 2009 |
| 47 |  Brunei Brunei |
146,000 | 0.17% | 2009 |
| 48 |  Japan Japan |
132,700 | 0.16% | 2009 |
| 49 |  Kingdom of Romania Kingdom of Romania |
117,000 | 0.14% | 2009 |
| 50 |  Chad Chad |
115,000 | 0.14% | 2009 |
| 51 |  Sudan Sudan |
111,700 | 0.14% | 2009 |
| 52 |  Ukraine Ukraine |
99,930 | 0.12% | 2009 |
| 53 |  East Timor East Timor |
96,270 | 0.11% | 2009 |
| 54 |  Tunisia Tunisia |
91,380 | 0.11% | 2009 |
| 55 |  Cameroon Cameroon |
77,310 | 0.09% | 2009 |
| 56 |  Uzbekistan Uzbekistan |
70,910 | 0.08% | 2009 |
| 57 |  Early Modern France Early Modern France |
70,820 | 0.08% | 2009 |
| 58 |  New Zealand New Zealand |
61,150 | 0.07% | 2009 |
| 59 |  Pakistan Pakistan |
59,140 | 0.07% | 2009 |
| 60 |  Côte d'Ivoire Côte d'Ivoire |
58,950 | 0.07% | 2009 |
| 61 |  Netherlands Netherlands |
57,190 | 0.07% | 2009 |
| 62 |  Turkey Turkey |
52,980 | 0.06% | 2009 |
| 63 |  Bahrain Bahrain |
48,560 | 0.06% | 2009 |
| 64 |  Cuba Cuba |
48,340 | 0.06% | 2009 |
| 65 |  South Korea South Korea |
48,180 | 0.06% | 2010 |
| 66 |  Bolivia Bolivia |
47,050 | 0.06% | 2010 |
| 67 |  Papua New Guinea Papua New Guinea |
35,090 | 0.04% | 2009 |
| 68 |  Poland Poland |
34,140 | 0.04% | 2009 |
| 69 |  Belarus Belarus |
31,400 | 0.04% | 2009 |
| 70 |  Spain Spain |
27,230 | 0.03% | 2009 |
| 71 |  Independent State of Croatia Independent State of Croatia |
23,960 | 0.03% | 2009 |
| 72 |  Austria Austria |
21,880 | 0.03% | 2009 |
| 73 |  Hungary Hungary |
21,430 | 0.03% | 2010 |
| 74 |  Myanmar Myanmar |
18,880 | 0.02% | 2009 |
| 75 |  United States Virgin Islands United States Virgin Islands |
16,870 | 0.02% | 2009 |
| 76 |  Mauritania Mauritania |
16,510 | 0.02% | 2009 |
| 77 |  Democratic Republic of the Congo Democratic Republic of the Congo |
16,360 | 0.02% | 2009 |
| 78 |  Suriname Suriname |
15,190 | 0.02% | 2009 |
| 79 |  Guatemala Guatemala |
13,530 | 0.02% | 2009 |
| 80 |  Serbia Serbia |
11,400 | 0.01% | 2010 |
| 81 |  Belgium Belgium |
11,220 | 0.01% | 2009 |
| 82 |  Czech Republic Czech Republic |
10,970 | 0.01% | 2009 |
| 83 |  Singapore Singapore |
10,910 | 0.01% | 2009 |
| 84 |  Chile Chile |
10,850 | 0.01% | 2009 |
| 85 |  Philippines Philippines |
9,671 | 0.01% | 2010 |
| 86 |  Finland Finland |
8,718 | 0.01% | 2009 |
| 87 |  Estonia Estonia |
7,600 | 0.01% | 2009 |
| 88 |  Ghana Ghana |
7,081 | 0.01% | 2009 |
| 89 |  Greece Greece |
6,779 | 0.01% | 2009 |
| 90 |  Lithuania Lithuania |
6,333 | 0.01% | 2009 |
| 91 |  Bangladesh Bangladesh |
5,733 | 0.01% | 2009 |
| 92 |  Albania Albania |
5,400 | 0.01% | 2009 |
| 93 |  Mongolia Mongolia |
5,100 | 0.01% | 2009 |
| 94 |  Sweden Sweden |
4,833 | 0.01% | 2009 |
| 95 |  Portugal Portugal |
4,721 | 0.01% | 2009 |
| 96 |  Slovakia Slovakia |
4,114 | 0.00% | 2009 |
| 97 |  Morocco Morocco |
4,053 | 0.00% | 2009 |
| 98 |  Belize Belize |
3,990 | 0.00% | 2009 |
| 99 |  Israel Israel |
3,806 | 0.00% | 2009 |
| 100 |  Switzerland Switzerland |
3,488 | 0.00% | 2009 |
| 101 |  Kingdom of Bulgaria Kingdom of Bulgaria |
3,227 | 0.00% | 2009 |
| 102 |  Aruba Aruba |
2,235 | 0.00% | 2009 |
| 103 |  Puerto Rico Puerto Rico |
1,783 | 0.00% | 2009 |
| 104 |  Uruguay Uruguay |
997 | 0.00% | 2010 |
| 105 |  Georgia (country) Georgia (country) |
995 | 0.00% | 2009 |
| 106 |  Kyrgyzstan Kyrgyzstan |
979 | 0.00% | 2009 |
| 107 |  Barbados Barbados |
765 | 0.00% | 2009 |
| 108 |  Tajikistan Tajikistan |
221 | 0.00% | 2009 |
| 109 |  Zambia Zambia |
160 | 0.00% | 2009 |
| 110 |  North Korea North Korea |
118 | 0.00% | 2009 |
| 111 |  Somalia Somalia |
108 | 0.00% | 2009 |
| 112 |  Paraguay Paraguay |
31 | 0.00% | 2009 |
| 113 |  Sierra Leone Sierra Leone |
29 | 0.00% | 2009 |
| 114 |  Slovenia Slovenia |
5 | 0.00% | 2009 |
| 115 |  Panama Panama |
2 | 0.00% | 2009 |
External links
- International Energy Statistics, US Energy Information Administration

