
Physics Analysis Workstation
Encyclopedia
CERN
The European Organization for Nuclear Research , known as CERN , is an international organization whose purpose is to operate the world's largest particle physics laboratory, which is situated in the northwest suburbs of Geneva on the Franco–Swiss border...
since 1986, it is optimized for processing very large amounts of data. It is based on and intended for interoperation with components of CERNLIB
CERN Program Library
The CERN Program Library or CERNLIB is a collection of FORTRAN77 libraries and modules, maintained "as is" by CERN. Its content ranges from more specialized data analysis of high energy physics to general purpose numerical analysis...
, an extensive collection of Fortran
Fortran
Fortran is a general-purpose, procedural, imperative programming language that is especially suited to numeric computation and scientific computing...
libraries.
PAW has been a standard tool in high energy physics for decades, yet has essentially grown beyond maintainability. Despite continuing popularity as of 2008, it has recently been losing ground to the C++
C++
C++ is a statically typed, free-form, multi-paradigm, compiled, general-purpose programming language. It is regarded as an intermediate-level language, as it comprises a combination of both high-level and low-level language features. It was developed by Bjarne Stroustrup starting in 1979 at Bell...
-based ROOT
ROOT
ROOT is an object-oriented program and library developed by CERN. It was originally designed for particle physics data analysis and contains several features specific to this field, but it is also used in other applications such as astronomy and data mining....
package.
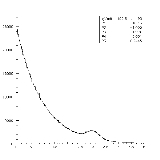
Sample script
PAW uses its own scripting language. Here's a sample code (with its actual output), which can be used to plot data gathered in files.- ---------------------
- input data
- ---------------------
vector/read X,Y input_file.dat
- --------------------------------
- eps plot
- --------------------------------
fort/file 55 gg_ggg_dsig_dphid_179181.eps
meta 55 -113
opt linx | linear scale
opt logy | logarithmic scale
- draw empy XY pane
graph/hplot/null 179.0 181.0 1e3 1e7
- ------------------------------------
- here goes plot
- ------------------------------------
set plci 1 | line color
set lwid 2 | line width
set dmod 1 | line type (solid, dotted, etc.)
graph 32 X Y l | 32 stands for input data lines in input file
- -----------------
- plot title
- -----------------
set txci 1
atitle '[f] (deg)' 'd[s]/d[f]! (mb)'
- ------------------
- plot comments
- ------------------
set txci 1
text 180.0 2e1 '[f]=179...181 deg' 0.12
close 55
return