Hubbert Linearization
Encyclopedia
The Hubbert Linearization is a way to plot production data to estimate two important parameters of a Hubbert curve
; the logistic
growth rate and the quantity of the resource that will be ultimately recovered. The Hubbert curve is the first derivative of a Logistic function
, which has been used in modeling depletion of crude oil
, predicting the Hubbert peak, population growth
predictions and the depletion of finite mineral resources. The technique was introduced by Marion King Hubbert in his 1982 review paper . The geologist Kenneth S. Deffeyes
has recently applied this technique to make a prediction about the peak production of conventional oil .
where K and URR are the logistic growth rate and the Ultimate Recoverable Resource respectively. We can rewrite (1) as the following:
 The above relation is a line equation in the P/Q versus Q plane. Consequently, a linear regression
on the data points gives us an estimate of the slope and intercept from which we can derive the Hubbert curve parameters:
the left term is often called the decline rate.
Hubbert curve
The Hubbert curve is an approximation of the production rate of a resource over time. It is a symmetric logistic distribution curve, often confused with the "normal" gaussian function. It first appeared in "Nuclear Energy and the Fossil Fuels," geophysicist M...
; the logistic
Logistic function
A logistic function or logistic curve is a common sigmoid curve, given its name in 1844 or 1845 by Pierre François Verhulst who studied it in relation to population growth. It can model the "S-shaped" curve of growth of some population P...
growth rate and the quantity of the resource that will be ultimately recovered. The Hubbert curve is the first derivative of a Logistic function
Logistic function
A logistic function or logistic curve is a common sigmoid curve, given its name in 1844 or 1845 by Pierre François Verhulst who studied it in relation to population growth. It can model the "S-shaped" curve of growth of some population P...
, which has been used in modeling depletion of crude oil
Oil depletion
Oil depletion occurs in the second half of the production curve of an oil well, oil field, or the average of total world oil production. The Hubbert peak theory makes predictions of production rates based on prior discovery rates and anticipated production rates. Hubbert curves predict that the...
, predicting the Hubbert peak, population growth
Population growth
Population growth is the change in a population over time, and can be quantified as the change in the number of individuals of any species in a population using "per unit time" for measurement....
predictions and the depletion of finite mineral resources. The technique was introduced by Marion King Hubbert in his 1982 review paper . The geologist Kenneth S. Deffeyes
Kenneth S. Deffeyes
Kenneth S. Deffeyes is a geologist who worked with M. King Hubbert, the creator of the Hubbert peak theory, at the Shell Oil Company research laboratory in Houston, Texas. Deffeyes holds a B.S. in petroleum geology from the Colorado School of Mines and a Ph.D. in geology from Princeton University,...
has recently applied this technique to make a prediction about the peak production of conventional oil .
Principle
The first step of the Hubbert linearization consists of plotting the production data (P) as a fraction of the cumulative production (Q) on the vertical axis and the cumulative production on the horizontal axis. This representation exploits the linear property of the logistic differential equation:where K and URR are the logistic growth rate and the Ultimate Recoverable Resource respectively. We can rewrite (1) as the following:

Linear regression
In statistics, linear regression is an approach to modeling the relationship between a scalar variable y and one or more explanatory variables denoted X. The case of one explanatory variable is called simple regression...
on the data points gives us an estimate of the slope and intercept from which we can derive the Hubbert curve parameters:
- the K parameter is the intercept with the vertical axis.
- the line slope is equal to -K/URR from which we derive the URR value.
US Oil Production
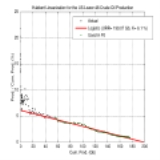
The chart on the right gives an example of the application of the Hubbert Linearization technique in the case of the US Lower-48 oil production. The fit of a line using the data points from 1956 to 2005 (in green) gives a URR of 199 Gb and a logistic growth rate of 6%.Second Hubbert Linearization
The Hubbert linearization principle can be extended to the second derivatives by computing the derivative of (2):the left term is often called the decline rate.
The Hubbert Parabola
This representation was proposed by Roberto Canogar and applied to the oil depletion problem:External links
- Does the Hubbert Linearization Ever Work? - The Oil DrumThe Oil DrumThe Oil Drum is a web-based, interactive energy, peak oil and sustainability think tank and community devoted to the discussion of energy issues and their impact on society. The Oil Drum is facilitated by the Institute for the Study of Energy and Our Future, a Colorado non-profit corporation...
- Hubbert's Peak, The Coal Question, and Climate Change - Peak Oil, Peak Coal, Peak fossil-fuels]
- Excel Workbook - Hubbert's Peak, The Coal Question, and Climate Change


