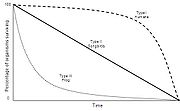
Survivorship curve
Encyclopedia

Chart
A chart is a graphical representation of data, in which "the data is represented by symbols, such as bars in a bar chart, lines in a line chart, or slices in a pie chart"...
showing the number or proportion of individuals surviving at each age for a given species or group (e.g. males/females). Survivorship curves can be constructed for a given cohort
Cohort (statistics)
In statistics and demography, a cohort is a group of subjects who have shared a particular time together during a particular time span . Cohorts may be tracked over extended periods in a cohort study. The cohort can be modified by censoring, i.e...
(a group of individuals of roughly the same age) based on a life table
Life table
In actuarial science, a life table is a table which shows, for each age, what the probability is that a person of that age will die before his or her next birthday...
.
There are three generalized types of survivorship curve, which are simply referred to as Type I, Type II and Type III curves.
- Type I survivorship curves are characterized by high survival in early and middle life, followed a rapid decline in survivorship in later life. HumanHumanHumans are the only living species in the Homo genus...
s are one of the species that show this pattern of survivorship.
- Type II curves are an intermediate between Type I and III, where roughly constant mortality rateMortality rateMortality rate is a measure of the number of deaths in a population, scaled to the size of that population, per unit time...
is experienced regardless of age. Some birdBirdBirds are feathered, winged, bipedal, endothermic , egg-laying, vertebrate animals. Around 10,000 living species and 188 families makes them the most speciose class of tetrapod vertebrates. They inhabit ecosystems across the globe, from the Arctic to the Antarctic. Extant birds range in size from...
s follow this pattern of survival.
- In Type III curves, the greatest mortality is experienced early on in life, with relatively low rates of death for those surviving this bottleneck. This type of curve is characteristic of species that produce a large number of offspringOffspringIn biology, offspring is the product of reproduction, of a new organism produced by one or more parents.Collective offspring may be known as a brood or progeny in a more general way...
(see r/K selection theoryR/K selection theoryIn ecology, r/K selection theory relates to the selection of combinations of traits in an organism that trade off between quantity or quality of offspring...
). One example of a species that follows this type of survivorship curve is the OctopusOctopusThe octopus is a cephalopod mollusc of the order Octopoda. Octopuses have two eyes and four pairs of arms, and like other cephalopods they are bilaterally symmetric. An octopus has a hard beak, with its mouth at the center point of the arms...
.
The number or proportion of organisms surviving is plotted on the y-axis
Cartesian coordinate system
A Cartesian coordinate system specifies each point uniquely in a plane by a pair of numerical coordinates, which are the signed distances from the point to two fixed perpendicular directed lines, measured in the same unit of length...
, generally with a logarithmic scale
Logarithmic scale
A logarithmic scale is a scale of measurement using the logarithm of a physical quantity instead of the quantity itself.A simple example is a chart whose vertical axis increments are labeled 1, 10, 100, 1000, instead of 1, 2, 3, 4...
starting with 1000 individuals, while their age, often as a proportion of maximum life span
Maximum life span
Maximum life span is a measure of the maximum amount of time one or more members of a population has been observed to survive between birth and death.Most living species have at least one upper limit on the number of times cells can divide...
, is plotted on the x-axis.

