Tissot's Indicatrix
Encyclopedia


Nicolas Auguste Tissot
Nicolas Auguste Tissot was a 19th-century French cartographer, who in 1859 and 1881 published an analysis of the distortion that occurs on map projections. He devised Tissot's indicatrix, or distortion circle, which when plotted on a map will appear as an ellipse whose elongation depends on the...
in 1859 and 1871 in order to characterize distortions due to map projection
Map projection
A map projection is any method of representing the surface of a sphere or other three-dimensional body on a plane. Map projections are necessary for creating maps. All map projections distort the surface in some fashion...
. It is the geometry that results from projecting
Projection (linear algebra)
In linear algebra and functional analysis, a projection is a linear transformation P from a vector space to itself such that P2 = P. It leaves its image unchanged....
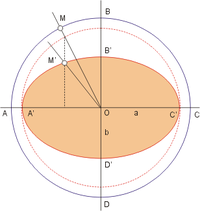
a circle of infinitesimal radius from a curved geometric model, such as a globe, onto a map. Tissot proved that the resulting diagram is an ellipse whose axes indicate the two principal directions
Principal curvature
In differential geometry, the two principal curvatures at a given point of a surface are the eigenvalues of the shape operator at the point. They measure how the surface bends by different amounts in different directions at that point.-Discussion:...
along which scale is maximal and minimal at that point on the map.
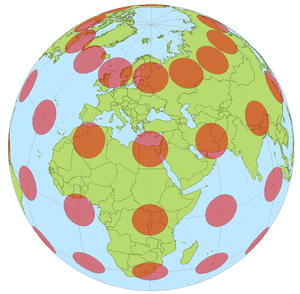
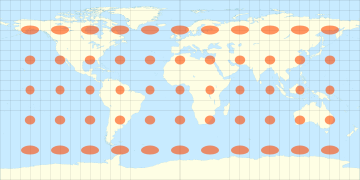
A single indicatrix describes the distortion at a single point. Because distortion varies across a map, generally Tissot’s indicatrices (plural of indicatrix) are placed across a map to illustrate the spatial change in distortion. A common scheme places them at each intersection of displayed meridians and parallels. These schematics are important in the study of map projections, both to illustrate distortion and to provide the basis for the calculations that represent the magnitude of distortion precisely at each point.
Description
Tissot’s theory was developed in the context of cartographic analysisCartography
Cartography is the study and practice of making maps. Combining science, aesthetics, and technique, cartography builds on the premise that reality can be modeled in ways that communicate spatial information effectively.The fundamental problems of traditional cartography are to:*Set the map's...
. Generally the geometric model represents the Earth, and comes in the form of a sphere
Sphere
A sphere is a perfectly round geometrical object in three-dimensional space, such as the shape of a round ball. Like a circle in two dimensions, a perfect sphere is completely symmetrical around its center, with all points on the surface lying the same distance r from the center point...
or ellipsoid.
Tissot’s indicatrices illustrate linear, angular and area distortions of maps:
- A map distorts distances (linear distortion) wherever the quotient between the lengths of an infinitesimally short line as projected onto the projection surface, and as it originally is on the Earth model, deviates from unity. The quotient is called the scale factor. Unless the projection is conformalConformal mapIn mathematics, a conformal map is a function which preserves angles. In the most common case the function is between domains in the complex plane.More formally, a map,...
at the point being considered, the scale factor varies by direction around the point. - A map distorts angles wherever the angles measured on the model of the Earth are not conserved in the projection. This is expressed by an ellipse of distortion which is not a circle.
- A map distorts areas wherever areas measured in the model of the Earth are not conserved in the projection. This is expressed by ellipses of distortion whose areas vary across the map.
In conformal maps, where each point preserves angles projected from the geometric model, the Tissot’s indicatrices are all circles of size varying by location. In equal-area projections, where area proportions between objects are conserved, the Tissot’s indicatrices all have the same area, though their shapes and orientations vary with location. In arbitrary projections, both area and shape vary across the map.
Mathematics

In dealing with a Tissot indicatrix, different notions of radius come into play. The first is the infinitesimal radius of the original circle. The resulting ellipse of distortion will also have infinitesimal radius, but by the mathematics of differentials
Differential calculus
In mathematics, differential calculus is a subfield of calculus concerned with the study of the rates at which quantities change. It is one of the two traditional divisions of calculus, the other being integral calculus....
, the ratios of these infinitesimal values are finite. So, for example, if the resulting ellipse of distortion is the same size of infinitesimal as on the sphere, then its radius is considered to be 1. Lastly, the size that the indicatrix gets drawn for human inspection on the map is arbitrary. When a network of indicatrices is drawn on a map, they are all scaled by the same arbitrary amount so that their sizes are proportionally correct.
External links
- Indicatrix calculator in Tal Carmon Research Homepage
- Java applet with interactive projections showing Tissot’s indicatrix

