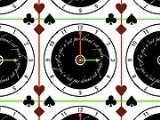
Conformal pictures
Encyclopedia
Here are examples of conformal map
s understood as deforming pictures. This technique is a generalization of domain coloring
where the domain space is not colored by a fixed infinite color wheel
but by a finite picture tiling the plane. A pedagogical interest is to have a flow of pictures coming from a webcam to allow more interactivity and a richer feedback loop.
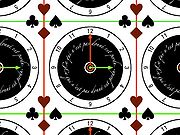
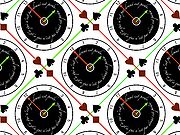
A conformal map
is a transformation of the plane preserving angles. The plane can be parametrized by Cartesian coordinates where a point is denoted as , but for conformal maps, it is better to understand it as the complex plane
where points are denoted .
.
In complex coordinates, the multiplication by a real number r corresponds to an homothety, by a unitary number to a rotation
of angle θ and by a generic complex number to a similarity mapping
.
A holomorphic function
is a conformal map because it is locally a similarity with
with  the derivative and
  the value of f at z0. The derivative is the local zoom factor of the transformation.
After similarities, which have constant derivative function, polynomial
s and in particular monomial
s are the simplest holomorphic functions. Its derivative is
  , it is null at the origin; hence the associated map is conformal only away from the origin.
A problem we face to represent them is that a holomorphic function is in general not injective: Consider the monomial for example, k different points are mapped to the same value.
Considering the plane tiled by the picture of the clock, it becomes, when squared the following blurry picture:
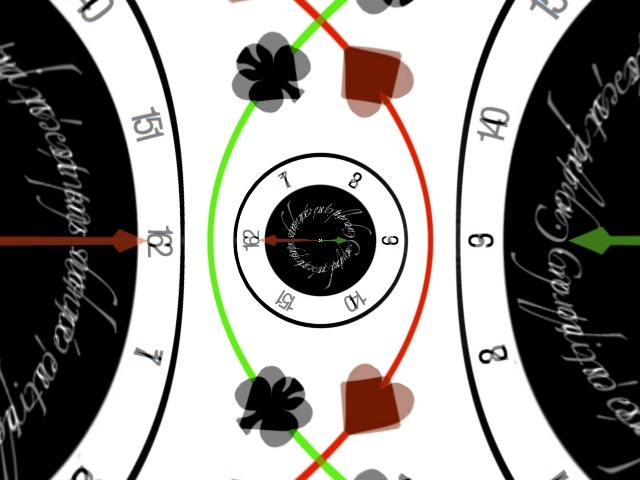
You see that the central disk is globally preserved, mapped to itself, but each point (except zero) is covered twice, rendering the picture blurry. For example +1 (at 3 oclock) and −1 (9:00) are both sent to +1 (to the middle right), +i (noon) and i (6:00) are sent to −1 (to the middle left).
In order to get an injective application, we can whether restrict ourselves, for example, to the positive real half plane, or to the negative real half plane.
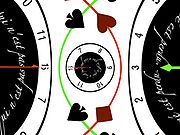
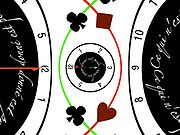
Seen from further away, you get the same big picture for the whole tiling.
The picture tiles no longer the domain
of the application but its target
space. The point z colored according to the pixel f(z).
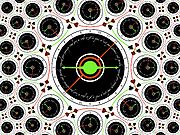 Notice the duplication: points z and −z are colored similarly because they are both mapped to the same image z2.
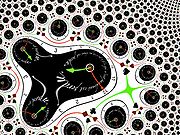
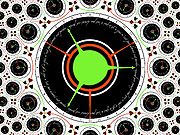 Likewise, the monomial of order k maps k different points to the same image.
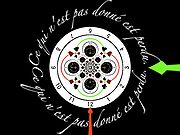
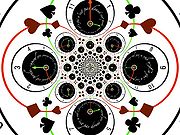
A lot of useful information can be understood concerning the conformal map by picturing its pull-back. Since the forward zoom factor is the derivative, the pull-back zoom factor is the 'inverse' of the derivative. Therefore something very special takes place at the zeros of the derivative of the function, the zoom factor becomes infinite, and it shows. Moreover the degree of the zero can be read by the number of time a feature repeats itself around the singularity. You notice as well when the derivative is real and positive, the picture is "standing up", and when it is real and negative, the picture is "upside-down". When you restrict yourself to the real axis, you can figure out a sketch of the graph
of a real function. You notice as well the inflexion points as a minimum or maximum of the zoom factor.
 The inversion
  has a simple pole at zero. It is a Möbius transformation
  with a, b, c and d four complexes such that
  , therefore it maps circles and lines to circles and lines. In particular horizontals and verticals become circles through zero. Inversion exchanges interior and exterior of the unit disk.
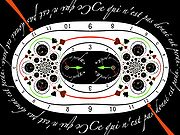
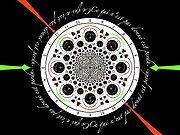 Like zeros, poles can be of higher order than simple. Circles are only infinitesimally preserved in general. You can picture higher order poles as several simple poles coming together.
 A very important map in complex analysis
and cartography is the transformation from cartesian coordinates (x,y) to polar coordinates (r,θ). This transformation is realized by the couple of functions logarithm
/exponential
reciprocal of each other ( ). Indeed,
 maps (r, θ) to (x = log(r), y = θ) and
  maps (x, y) to (r = exp(x), θ = y).
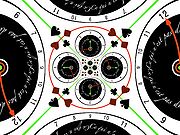
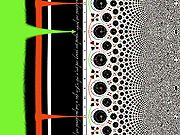
In picture, the logarithm unwraps circles centered at the origin into vertical lines, and maps rays to horizontal lines. The exponential on the contrary wraps vertical lines into concentric circles, and maps horizontal lines to rays through the origin. Notice that the logarithm goes to infinity at zero, but at a much slower pace than the inversion.
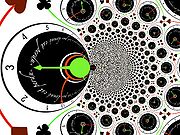
Changing the basis of the lattice, one can obtain spiral variations. As poles and zeros, logarithmic singularities can be added.
 Analytic function
s suffer from another type of singularities, for example the essential singularity
 is zero for
  , with an accumulation of zeros, and an accumulation of poles for
  .
.
admits a convergence radius. Comparison of pull-backs of the function and its truncated Taylor series allows us to illustrate this notion:
Conformal map
In mathematics, a conformal map is a function which preserves angles. In the most common case the function is between domains in the complex plane.More formally, a map,...
s understood as deforming pictures. This technique is a generalization of domain coloring
Domain coloring
Domain coloring is a technique for visualizing functions of a complex variable. The term "domain coloring" was coined by Frank Farris possibly around 1998...
where the domain space is not colored by a fixed infinite color wheel
Color wheel
A color wheel or color circle is an abstract illustrative organization of color hues around a circle that shows relationships between primary colors, secondary colors, complementary colors, etc....
but by a finite picture tiling the plane. A pedagogical interest is to have a flow of pictures coming from a webcam to allow more interactivity and a richer feedback loop.
Conformal maps


A conformal map
Conformal map
In mathematics, a conformal map is a function which preserves angles. In the most common case the function is between domains in the complex plane.More formally, a map,...
is a transformation of the plane preserving angles. The plane can be parametrized by Cartesian coordinates where a point is denoted as
 , but for conformal maps, it is better to understand it as the complex plane
Complex plane
In mathematics, the complex plane or z-plane is a geometric representation of the complex numbers established by the real axis and the orthogonal imaginary axis...
where points are denoted
 .
.In complex coordinates, the multiplication by a real number r corresponds to an homothety, by a unitary number
 to a rotation
Rotation
A rotation is a circular movement of an object around a center of rotation. A three-dimensional object rotates always around an imaginary line called a rotation axis. If the axis is within the body, and passes through its center of mass the body is said to rotate upon itself, or spin. A rotation...
of angle θ and by a generic complex number
 to a similarity mapping
Similarity (geometry)
Two geometrical objects are called similar if they both have the same shape. More precisely, either one is congruent to the result of a uniform scaling of the other...
.
A holomorphic function
Holomorphic function
In mathematics, holomorphic functions are the central objects of study in complex analysis. A holomorphic function is a complex-valued function of one or more complex variables that is complex differentiable in a neighborhood of every point in its domain...
is a conformal map because it is locally a similarity
 with
with  the derivative and
  the value of f at z0. The derivative is the local zoom factor of the transformation.
After similarities, which have constant derivative function, polynomial
Polynomial
In mathematics, a polynomial is an expression of finite length constructed from variables and constants, using only the operations of addition, subtraction, multiplication, and non-negative integer exponents...
s and in particular monomial
Monomial
In mathematics, in the context of polynomials, the word monomial can have one of two different meanings:*The first is a product of powers of variables, or formally any value obtained by finitely many multiplications of a variable. If only a single variable x is considered, this means that any...
s
 are the simplest holomorphic functions. Its derivative is
  , it is null at the origin; hence the associated map is conformal only away from the origin.
A problem we face to represent them is that a holomorphic function is in general not injective: Consider the monomial
 for example, k different points are mapped to the same value.
Considering the plane tiled by the picture of the clock, it becomes, when squared the following blurry picture:

You see that the central disk is globally preserved, mapped to itself, but each point (except zero) is covered twice, rendering the picture blurry. For example +1 (at 3 oclock) and −1 (9:00) are both sent to +1 (to the middle right), +i (noon) and i (6:00) are sent to −1 (to the middle left).
In order to get an injective application, we can whether restrict ourselves, for example, to the positive real half plane, or to the negative real half plane.


Seen from further away, you get the same big picture for the whole tiling.
Pull-back
To get a nice conformal picture, it is easier to consider not the direct image but the pulled-back image:The picture tiles no longer the domain
Domain (mathematics)
In mathematics, the domain of definition or simply the domain of a function is the set of "input" or argument values for which the function is defined...
of the application but its target
Range (mathematics)
In mathematics, the range of a function refers to either the codomain or the image of the function, depending upon usage. This ambiguity is illustrated by the function f that maps real numbers to real numbers with f = x^2. Some books say that range of this function is its codomain, the set of all...
space. The point z colored according to the pixel f(z).


A lot of useful information can be understood concerning the conformal map by picturing its pull-back. Since the forward zoom factor is the derivative, the pull-back zoom factor is the 'inverse' of the derivative. Therefore something very special takes place at the zeros of the derivative of the function, the zoom factor becomes infinite, and it shows. Moreover the degree of the zero can be read by the number of time a feature repeats itself around the singularity. You notice as well when the derivative is real and positive, the picture is "standing up", and when it is real and negative, the picture is "upside-down". When you restrict yourself to the real axis, you can figure out a sketch of the graph
Graph of a function
In mathematics, the graph of a function f is the collection of all ordered pairs . In particular, if x is a real number, graph means the graphical representation of this collection, in the form of a curve on a Cartesian plane, together with Cartesian axes, etc. Graphing on a Cartesian plane is...
of a real function. You notice as well the inflexion points as a minimum or maximum of the zoom factor.
Inversion, poles
After holomorphic functions, locally conformal maps comprise as well meromorphic functions, and the position and order of their poles can be read-off.

 has a simple pole at zero. It is a Möbius transformation
  with a, b, c and d four complexes such that
  , therefore it maps circles and lines to circles and lines. In particular horizontals and verticals become circles through zero. Inversion exchanges interior and exterior of the unit disk.

Logarithm and exponential


Complex analysis
Complex analysis, traditionally known as the theory of functions of a complex variable, is the branch of mathematical analysis that investigates functions of complex numbers. It is useful in many branches of mathematics, including number theory and applied mathematics; as well as in physics,...
and cartography is the transformation from cartesian coordinates (x,y) to polar coordinates (r,θ). This transformation is realized by the couple of functions logarithm
Logarithm
The logarithm of a number is the exponent by which another fixed value, the base, has to be raised to produce that number. For example, the logarithm of 1000 to base 10 is 3, because 1000 is 10 to the power 3: More generally, if x = by, then y is the logarithm of x to base b, and is written...
/exponential
Exponential function
In mathematics, the exponential function is the function ex, where e is the number such that the function ex is its own derivative. The exponential function is used to model a relationship in which a constant change in the independent variable gives the same proportional change In mathematics,...
reciprocal of each other (
 ). Indeed,
 maps (r, θ) to (x = log(r), y = θ) and
  maps (x, y) to (r = exp(x), θ = y).
In picture, the logarithm unwraps circles centered at the origin into vertical lines, and maps rays to horizontal lines. The exponential on the contrary wraps vertical lines into concentric circles, and maps horizontal lines to rays through the origin. Notice that the logarithm goes to infinity at zero, but at a much slower pace than the inversion.
Changing the basis of the lattice, one can obtain spiral variations. As poles and zeros, logarithmic singularities can be added.
Essential singularity

Analytic function
In mathematics, an analytic function is a function that is locally given by a convergent power series. There exist both real analytic functions and complex analytic functions, categories that are similar in some ways, but different in others...
s suffer from another type of singularities, for example the essential singularity
Essential singularity
In complex analysis, an essential singularity of a function is a "severe" singularity near which the function exhibits extreme behavior.The category essential singularity is a "left-over" or default group of singularities that are especially unmanageable: by definition they fit into neither of the...
 is zero for
  , with an accumulation of zeros, and an accumulation of poles for
  .
.Convergence radius
Analytic functions are summable in power series. At a given point, its Taylor seriesTaylor series
In mathematics, a Taylor series is a representation of a function as an infinite sum of terms that are calculated from the values of the function's derivatives at a single point....
admits a convergence radius. Comparison of pull-backs of the function and its truncated Taylor series allows us to illustrate this notion:
External links
- The pictures were deformed using this Java applet; Another version is available for Mac OS XMac OS XMac OS X is a series of Unix-based operating systems and graphical user interfaces developed, marketed, and sold by Apple Inc. Since 2002, has been included with all new Macintosh computer systems...
that deforms the video flux from the webcam.java -d32 -jar ComplexMap.jar. That's great fun. Using Java Tools for Experimental Mathematics library. - Conformal Mapping Module by John H. Mathews
- interactive visualizations of many conformal maps
- Java applets for visualization of conformal maps
- Conformal Maps by Michael Trott, Wolfram Demonstrations ProjectWolfram Demonstrations ProjectThe Wolfram Demonstrations Project is hosted by Wolfram Research, whose stated goal is to bring computational exploration to the widest possible audience. It consists of an organized, open-source collection of small interactive programs called Demonstrations, which are meant to visually and...
. - Java applet by Jürgen Richter-Gebert using CinderellaCinderella (software)Cinderella is a proprietary interactive geometry software, written in Java programming language.- History :Cinderella was initially developed by Jürgen Richter-Gebert and Henry Crapo and was used to input incidence theorems and conjectures for automatic theorem proving using the binomial proving...
.

