
Davenport diagram
Encyclopedia
In acid base physiology, the Davenport Diagram is a graphical tool, developed by Allan Jones Davenport, that allows a clinician or investigator to describe blood
bicarbonate
concentrations and blood pH
following a respiratory and/or metabolic acid-base disturbance. The diagram depicts a three-dimensional surface describing all possible states of chemical equilibria between gaseous carbon dioxide
, aqueous bicarbonate and aqueous protons at the physiologically complex interface of the alveoli of the lungs and the alveolar capillaries. Although the surface represented in the diagram is experimentally determined, the Davenport Diagram is primarily a conceptual tool, allowing the investigator to envision the effects of physiological changes on blood acid-base chemistry. The Davenport Diagram is rarely used in the clinical setting.
laboratory experiment
, carbon dioxide in the air rapidly enters into equilibrium
with carbon dioxide derivatives and other species in the aqueous solution
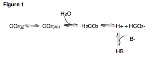
. Figure 1 illustrates the most important equilibrium reactions of carbon dioxide in blood relating to acid-base physiology:

Note that in this equation, the HB/B- buffer
system represents all non-bicarbonate buffers present in the blood, such as hemoglobin
in its various protonated and deprotonated states. Because many different non-bicarbonate buffers are present in human blood, the final equilibrium state reached at any given PCO2 is highly complex and cannot be readily predicted using theory
alone. By depicting experimental results, the Davenport Diagram provides a simple approach to describing the behavior of this complex system.
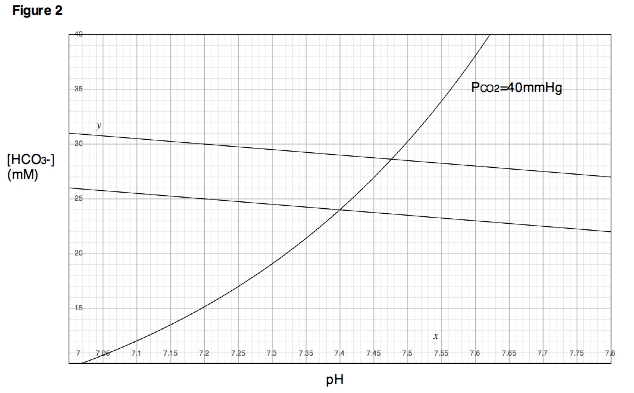
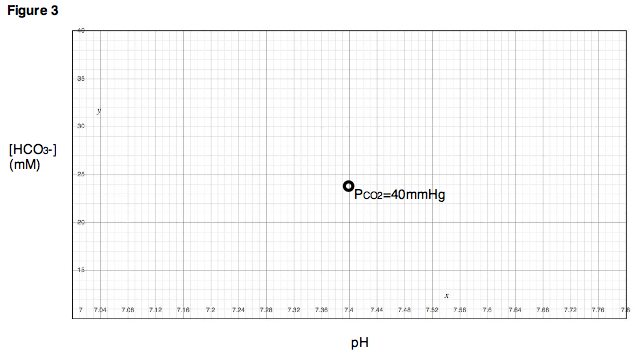
Figure 2 shows a Davenport Diagram as commonly depicted in textbooks and the literature. To understand how the diagram is to be interpreted, it is helpful to understand how the diagram is derived in the first place. Consider the following experiment. A small sample of blood is taken from a healthy patient and placed in a chamber in which the partial pressure
of carbon dioxide (PCO2) is held at 40 mmHg. Once equilibrium is reached, the pH and bicarbonate concentration are measured and plotted on a chart as in Fig. 3.
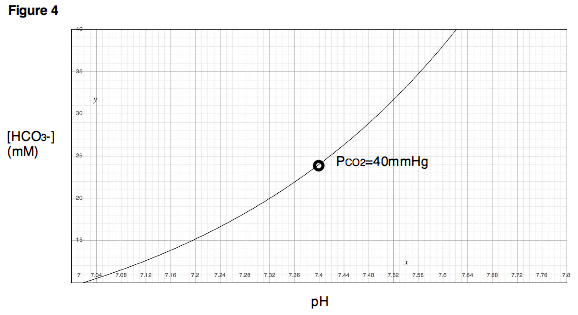
Next, the PCO2 in the chamber is held constant while the pH of the blood sample is changed, first by adding a strong acid
, then by adding a strong base. As pH is varied, a titration
curve for the sample is produced (Fig. 4). Notice that this titration curve is valid only at a PCO2 of 40 mmHg, because the chamber was held at this partial pressure throughout the experiment.
Next, imagine that the experimenter obtains a new, identical blood sample from the same patient. However, instead of placing the sample in a chamber with a PCO2 of 40 mmHg, the chamber is reset to a PCO2 of 60 mmHg. After equilibration, a new point is reached, indicating a new pH and a new bicarbonate concentration (Fig 5). Note that the bicarbonate concentration at the new, higher PCO2 is larger than in the first measurement, whereas the pH is now smaller. Neither result should come as a surprise. Increasing the PCO2 means that the total amount of carbon dioxide in the system has increased. Because the gaseous carbon dioxide is in equilibrium with the carbon dioxide derivatives in the solution, the concentrations of carbon dioxide derivatives, including bicarbonate, should also increase. The fall in pH is also not surprising, since the formation of a bicarbonate molecule is concomitant with the release of a proton
(see Fig. 1).

If this same experiment is repeated at various partial pressures of carbon dioxide, a series of points will be obtained. One can draw a line through these points, called the buffer line (Fig. 6).
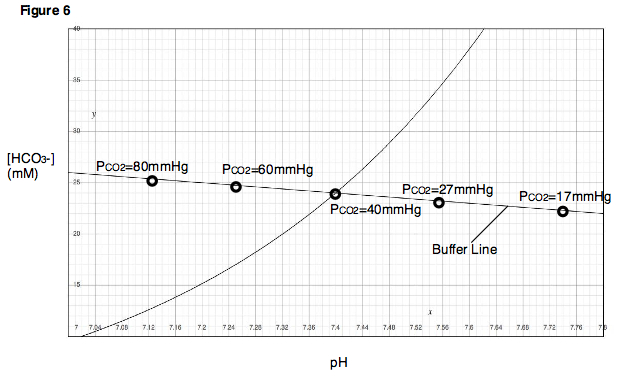
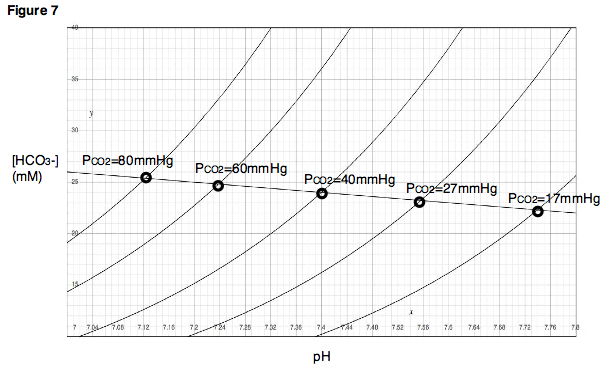
The buffer line can be used to predict the result of varying the PCO2 within a range close to the experimentally determined points. Additionally, for each experimental point, a titration experiment can be performed in which pH is varied while PCO2 is held constant, and titration curves can be generated for each of the partial pressure of carbon dioxide (Fig. 7). In the Davenport Diagram, these titration curves are called isopleths, because they are generated at a fixed partial pressure of carbon dioxide.
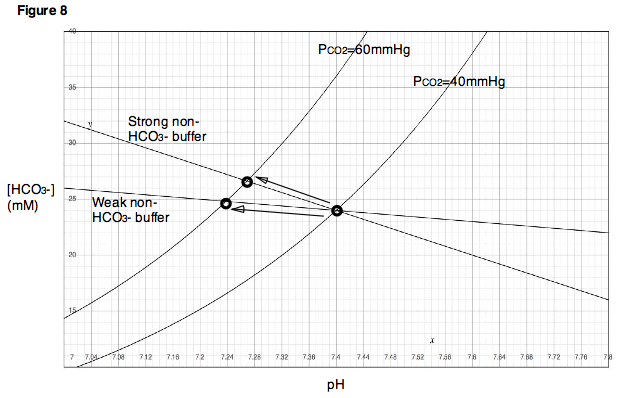
A key concept in understanding the Davenport Diagram is to note that as PCO2 is increased, the magnitude
of the resulting change in pH is dependent on the buffering power of the non-bicarbonate buffers present in the solution. If strong non-bicarbonate buffers are present, then they will quickly absorb the vast majority of protons released by the formation of bicarbonate, and pH will change very little for a given rise in bicarbonate concentration. The result will be a buffer line with a very steep slope
(Fig. 8). On the other hand, if only weak non-bicarbonate buffers are present (or if no non-bicarbonate buffer is present at all), then a much larger change in pH will be observed for a given change in bicarbonate concentration, and the buffer line will have a slope closer to zero.
It is instructive to note that the slope of the bicarbonate line will never actually reach zero (i.e. will never be horizontal) under equilibrium conditions, even in the complete absence of non-bicarbonate buffers. This is because the production of protons resulting from an increase in PCO2 is concomitant with the production of bicarbonate ions, as mentioned previously. Thus, a decrease in pH resulting from increased PCO2 must always occur with some minimal increase in bicarbonate concentration. Likewise, an increase in pH for similar reasons must occur with some minimal decrease in bicarbonate concentration.
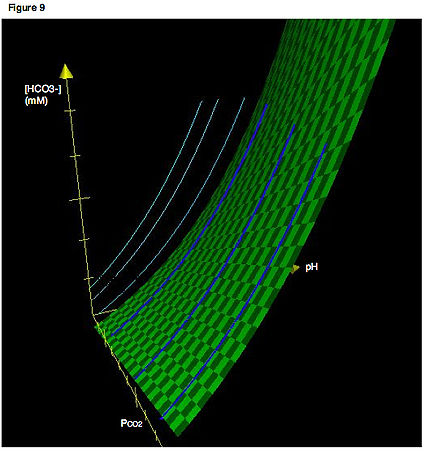
A more accurate depiction would involve three axes. Figure 9 shows a Davenport Diagram in three dimensions. The light blue lines indicate the isopleths as we would normally encounter them, confined to a two-dimensional plane. The dark blue curves show the actual locations of the isopleths in three dimensions. Thus, the light blue lines are simply the projections of the isopleths in three-dimensional space onto a two-dimensional plane. Again, recall that an isopleth is just a titration curve—that is, the path that is traced if pH is varied while PCO2 is held constant. The green surface describes all combinations of PCO2, [HCO3-] and pH that satisfy equilibrium for the system. All isopleths in their actual three-dimensional orientations must be confined to this surface.
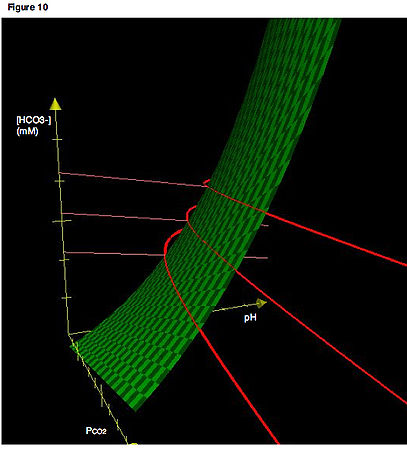
 A second key concept is that movement along a buffer line must correspond to a change in PCO2. Thus, like the isopleths, the buffer line as drawn on a typical Davenport Diagram (e.g., Fig 6) is actually the projection of a line existing in three-dimensional space onto a two-dimensional plane. As with the isopleths, buffer lines in their actual three-dimensional orientation are confined to the surface representing the values of PCO2, [HCO3-] and pH that satisfy equilibrium for the system. In Fig. 10, the dark red lines are the actual buffer lines in three-dimensional space, while the light red lines are the projections of the buffer lines onto a two-dimensional plane. (We will see later how multiple, parallel buffer lines can be determined for a given system).
and/or metabolism
. Four fundamental changes may occur that affect acid-base balance in the body: respiratory acidosis
, respiratory alkalosis
, metabolic acidosis
and metabolic alkalosis
. Additionally, a respiratory and a metabolic disturbance may occur simultaneously, such as respiratory acidosis followed by a compensatory shift towards metabolic alkalosis.
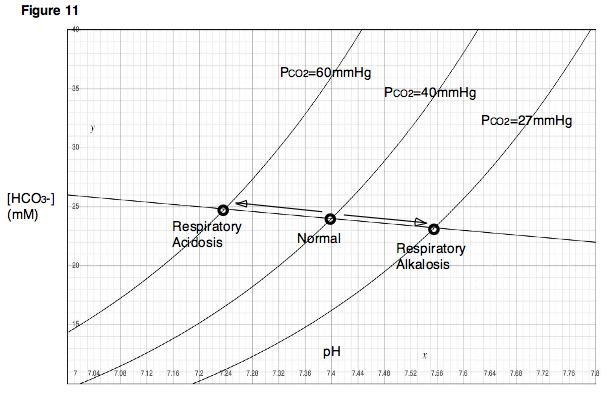
on PCO2 in the lungs. If one were to hold his or her breath (or breathe very slowly, as in the case of respiratory depression), the blood would continue delivering carbon dioxide to the alveoli in the lungs, and the amount of carbon dioxide in the lungs would increase. On the other hand, if one were to hyperventilate, then fresh air would be drawn into the lungs and carbon dioxide would rapidly be blown out. In the first case, because carbon dioxide is accumulating in the lungs, alveolar PCO2 would become very high. In the second case, because carbon dioxide is rapidly exiting the lungs, alveolar PCO2 would be very low. Note that these two situations, those of respiratory depression and hyperventilation, produce effects that are immediately analogous to the experiment described previously, in which the partial pressures of carbon dioxide were varied and the resulting changes in pH observed. As indicated by the Davenport Diagram, respiratory depression, which results in a high PCO2, will lower blood pH. Hyperventilation will have the opposite effects. A decrease in blood pH due to respiratory depression is called respiratory acidosis. An increase in blood pH due to hyperventilation is called respiratory alkalosis (Fig. 11).
ions, for example, when added to the solution, will react with free hydrogen ions and increase the pH of the solution. Additionally, hydroxide ions will abstract protons from carbonic acid
in solution, causing the bicarbonate concentration to increase. The new position on the diagram following addition of hydroxide ions no longer lies on our original buffer line. However, if the PCO2 is now varied without further addition of strong acid or strong base to the solution, a new buffer line can be determined that lies above and approximately parallel to the original buffer line.
Similarly, in a physiologic system such as a living body, removal of protons, for example, by vomiting
the acidic contents of the stomach
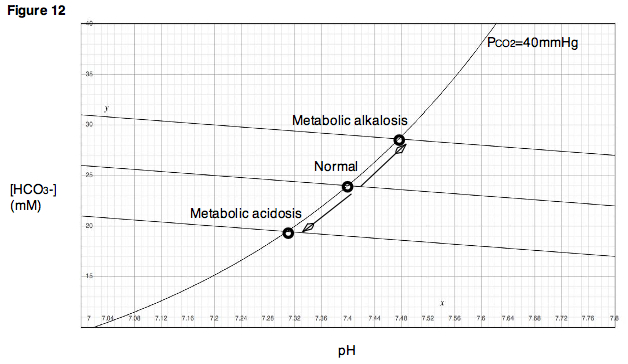
, will result in an increase in pH and an increase in bicarbonate concentration, bringing the system to a new, higher buffer line. Such a disturbance is called a metabolic alkalosis (Fig. 12). Alternatively, if protons are added to the bloodstream in the form of acidic metabolites, as occurs during diabetic ketoacidosis
, then pH will fall, along with bicarbonate concentration. This type of disturbance is called a metabolic acidosis. In the case of metabolic acidosis, the new buffer line lies below the original line.
Blood
Blood is a specialized bodily fluid in animals that delivers necessary substances such as nutrients and oxygen to the cells and transports metabolic waste products away from those same cells....
bicarbonate
Bicarbonate
In inorganic chemistry, bicarbonate is an intermediate form in the deprotonation of carbonic acid...
concentrations and blood pH
PH
In chemistry, pH is a measure of the acidity or basicity of an aqueous solution. Pure water is said to be neutral, with a pH close to 7.0 at . Solutions with a pH less than 7 are said to be acidic and solutions with a pH greater than 7 are basic or alkaline...
following a respiratory and/or metabolic acid-base disturbance. The diagram depicts a three-dimensional surface describing all possible states of chemical equilibria between gaseous carbon dioxide
Carbon dioxide
Carbon dioxide is a naturally occurring chemical compound composed of two oxygen atoms covalently bonded to a single carbon atom...
, aqueous bicarbonate and aqueous protons at the physiologically complex interface of the alveoli of the lungs and the alveolar capillaries. Although the surface represented in the diagram is experimentally determined, the Davenport Diagram is primarily a conceptual tool, allowing the investigator to envision the effects of physiological changes on blood acid-base chemistry. The Davenport Diagram is rarely used in the clinical setting.
Derivation
When a sample of blood is exposed to air, either in the alveoli of the lung or in an in vitroIn vitro
In vitro refers to studies in experimental biology that are conducted using components of an organism that have been isolated from their usual biological context in order to permit a more detailed or more convenient analysis than can be done with whole organisms. Colloquially, these experiments...
laboratory experiment
Experiment
An experiment is a methodical procedure carried out with the goal of verifying, falsifying, or establishing the validity of a hypothesis. Experiments vary greatly in their goal and scale, but always rely on repeatable procedure and logical analysis of the results...
, carbon dioxide in the air rapidly enters into equilibrium
Chemical equilibrium
In a chemical reaction, chemical equilibrium is the state in which the concentrations of the reactants and products have not yet changed with time. It occurs only in reversible reactions, and not in irreversible reactions. Usually, this state results when the forward reaction proceeds at the same...
with carbon dioxide derivatives and other species in the aqueous solution
Solution
In chemistry, a solution is a homogeneous mixture composed of only one phase. In such a mixture, a solute is dissolved in another substance, known as a solvent. The solvent does the dissolving.- Types of solutions :...
. Figure 1 illustrates the most important equilibrium reactions of carbon dioxide in blood relating to acid-base physiology:
Note that in this equation, the HB/B- buffer
Buffer solution
A buffer solution is an aqueous solution consisting of a mixture of a weak acid and its conjugate base or a weak base and its conjugate acid. It has the property that the pH of the solution changes very little when a small amount of strong acid or base is added to it. Buffer solutions are used as a...
system represents all non-bicarbonate buffers present in the blood, such as hemoglobin
Hemoglobin
Hemoglobin is the iron-containing oxygen-transport metalloprotein in the red blood cells of all vertebrates, with the exception of the fish family Channichthyidae, as well as the tissues of some invertebrates...
in its various protonated and deprotonated states. Because many different non-bicarbonate buffers are present in human blood, the final equilibrium state reached at any given PCO2 is highly complex and cannot be readily predicted using theory
Theory
The English word theory was derived from a technical term in Ancient Greek philosophy. The word theoria, , meant "a looking at, viewing, beholding", and referring to contemplation or speculation, as opposed to action...
alone. By depicting experimental results, the Davenport Diagram provides a simple approach to describing the behavior of this complex system.
Figure 2 shows a Davenport Diagram as commonly depicted in textbooks and the literature. To understand how the diagram is to be interpreted, it is helpful to understand how the diagram is derived in the first place. Consider the following experiment. A small sample of blood is taken from a healthy patient and placed in a chamber in which the partial pressure
Partial pressure
In a mixture of ideal gases, each gas has a partial pressure which is the pressure which the gas would have if it alone occupied the volume. The total pressure of a gas mixture is the sum of the partial pressures of each individual gas in the mixture....
of carbon dioxide (PCO2) is held at 40 mmHg. Once equilibrium is reached, the pH and bicarbonate concentration are measured and plotted on a chart as in Fig. 3.
Next, the PCO2 in the chamber is held constant while the pH of the blood sample is changed, first by adding a strong acid
Strong acid
A strong acid is an acid that ionizes completely in an aqueous solution by losing one proton, according to the equationFor sulfuric acid which is diprotic, the "strong acid" designation refers only to dissociation of the first protonMore precisely, the acid must be stronger in aqueous solution than...
, then by adding a strong base. As pH is varied, a titration
Titration
Titration, also known as titrimetry, is a common laboratory method of quantitative chemical analysis that is used to determine the unknown concentration of an identified analyte. Because volume measurements play a key role in titration, it is also known as volumetric analysis. A reagent, called the...
curve for the sample is produced (Fig. 4). Notice that this titration curve is valid only at a PCO2 of 40 mmHg, because the chamber was held at this partial pressure throughout the experiment.
Next, imagine that the experimenter obtains a new, identical blood sample from the same patient. However, instead of placing the sample in a chamber with a PCO2 of 40 mmHg, the chamber is reset to a PCO2 of 60 mmHg. After equilibration, a new point is reached, indicating a new pH and a new bicarbonate concentration (Fig 5). Note that the bicarbonate concentration at the new, higher PCO2 is larger than in the first measurement, whereas the pH is now smaller. Neither result should come as a surprise. Increasing the PCO2 means that the total amount of carbon dioxide in the system has increased. Because the gaseous carbon dioxide is in equilibrium with the carbon dioxide derivatives in the solution, the concentrations of carbon dioxide derivatives, including bicarbonate, should also increase. The fall in pH is also not surprising, since the formation of a bicarbonate molecule is concomitant with the release of a proton
Proton
The proton is a subatomic particle with the symbol or and a positive electric charge of 1 elementary charge. One or more protons are present in the nucleus of each atom, along with neutrons. The number of protons in each atom is its atomic number....
(see Fig. 1).
If this same experiment is repeated at various partial pressures of carbon dioxide, a series of points will be obtained. One can draw a line through these points, called the buffer line (Fig. 6).
The buffer line can be used to predict the result of varying the PCO2 within a range close to the experimentally determined points. Additionally, for each experimental point, a titration experiment can be performed in which pH is varied while PCO2 is held constant, and titration curves can be generated for each of the partial pressure of carbon dioxide (Fig. 7). In the Davenport Diagram, these titration curves are called isopleths, because they are generated at a fixed partial pressure of carbon dioxide.
A key concept in understanding the Davenport Diagram is to note that as PCO2 is increased, the magnitude
Magnitude (mathematics)
The magnitude of an object in mathematics is its size: a property by which it can be compared as larger or smaller than other objects of the same kind; in technical terms, an ordering of the class of objects to which it belongs....
of the resulting change in pH is dependent on the buffering power of the non-bicarbonate buffers present in the solution. If strong non-bicarbonate buffers are present, then they will quickly absorb the vast majority of protons released by the formation of bicarbonate, and pH will change very little for a given rise in bicarbonate concentration. The result will be a buffer line with a very steep slope
Slope
In mathematics, the slope or gradient of a line describes its steepness, incline, or grade. A higher slope value indicates a steeper incline....
(Fig. 8). On the other hand, if only weak non-bicarbonate buffers are present (or if no non-bicarbonate buffer is present at all), then a much larger change in pH will be observed for a given change in bicarbonate concentration, and the buffer line will have a slope closer to zero.
It is instructive to note that the slope of the bicarbonate line will never actually reach zero (i.e. will never be horizontal) under equilibrium conditions, even in the complete absence of non-bicarbonate buffers. This is because the production of protons resulting from an increase in PCO2 is concomitant with the production of bicarbonate ions, as mentioned previously. Thus, a decrease in pH resulting from increased PCO2 must always occur with some minimal increase in bicarbonate concentration. Likewise, an increase in pH for similar reasons must occur with some minimal decrease in bicarbonate concentration.
The Davenport Diagram is a Two-Dimensional Representation of a Three-Dimensional Surface
Recall that the relationship represented in a Davenport Diagram is a relationship between three variables: PCO2, bicarbonate concentration and pH. Thus, Fig. 7 can be thought of as a topographical map—that is, a two-dimensional representation of a three-dimensional surface—where each isopleth indicates a different partial pressure or “altitude.”A more accurate depiction would involve three axes. Figure 9 shows a Davenport Diagram in three dimensions. The light blue lines indicate the isopleths as we would normally encounter them, confined to a two-dimensional plane. The dark blue curves show the actual locations of the isopleths in three dimensions. Thus, the light blue lines are simply the projections of the isopleths in three-dimensional space onto a two-dimensional plane. Again, recall that an isopleth is just a titration curve—that is, the path that is traced if pH is varied while PCO2 is held constant. The green surface describes all combinations of PCO2, [HCO3-] and pH that satisfy equilibrium for the system. All isopleths in their actual three-dimensional orientations must be confined to this surface.
Respiratory and Metabolic Acid-Base Disturbances
One of the most important features of the Davenport Diagram is its usefulness in depicting movement from one point on the equilibrium surface to another following changes in respirationRespiration (physiology)
'In physiology, respiration is defined as the transport of oxygen from the outside air to the cells within tissues, and the transport of carbon dioxide in the opposite direction...
and/or metabolism
Metabolism
Metabolism is the set of chemical reactions that happen in the cells of living organisms to sustain life. These processes allow organisms to grow and reproduce, maintain their structures, and respond to their environments. Metabolism is usually divided into two categories...
. Four fundamental changes may occur that affect acid-base balance in the body: respiratory acidosis
Respiratory acidosis
Respiratory acidosis is a medical condition in which decreased ventilation causes increased blood carbon dioxide concentration and decreased pH ....
, respiratory alkalosis
Respiratory alkalosis
Respiratory alkalosis is a medical condition in which increased respiration elevates the blood pH...
, metabolic acidosis
Metabolic acidosis
In medicine, metabolic acidosis is a condition that occurs when the body produces too much acid or when the kidneys are not removing enough acid from the body. If unchecked, metabolic acidosis leads to acidemia, i.e., blood pH is low due to increased production of hydrogen by the body or the...
and metabolic alkalosis
Metabolic alkalosis
Metabolic alkalosis is a metabolic condition in which the pH of tissue is elevated beyond the normal range . This is the result of decreased hydrogen ion concentration, leading to increased bicarbonate, or alternatively a direct result of increased bicarbonate concentrations.-Terminology:*Alkalosis...
. Additionally, a respiratory and a metabolic disturbance may occur simultaneously, such as respiratory acidosis followed by a compensatory shift towards metabolic alkalosis.
Respiratory Disturbances
To understand how changes in respiration might affect blood pH, consider the effects of ventilationVentilation (physiology)
In respiratory physiology, ventilation is the rate at which gas enters or leaves the lung. It is categorized under the following definitions:-Sample values:...
on PCO2 in the lungs. If one were to hold his or her breath (or breathe very slowly, as in the case of respiratory depression), the blood would continue delivering carbon dioxide to the alveoli in the lungs, and the amount of carbon dioxide in the lungs would increase. On the other hand, if one were to hyperventilate, then fresh air would be drawn into the lungs and carbon dioxide would rapidly be blown out. In the first case, because carbon dioxide is accumulating in the lungs, alveolar PCO2 would become very high. In the second case, because carbon dioxide is rapidly exiting the lungs, alveolar PCO2 would be very low. Note that these two situations, those of respiratory depression and hyperventilation, produce effects that are immediately analogous to the experiment described previously, in which the partial pressures of carbon dioxide were varied and the resulting changes in pH observed. As indicated by the Davenport Diagram, respiratory depression, which results in a high PCO2, will lower blood pH. Hyperventilation will have the opposite effects. A decrease in blood pH due to respiratory depression is called respiratory acidosis. An increase in blood pH due to hyperventilation is called respiratory alkalosis (Fig. 11).
Metabolic Disturbances
Changes in the metabolic composition of blood can also affect blood pH. Again, recall from our initial experiment that if strong acid or strong base is added to the blood sample, pH and bicarbonate concentration will change accordingly, resulting in a titration curve. HydroxideHydroxide
Hydroxide is a diatomic anion with chemical formula OH−. It consists of an oxygen and a hydrogen atom held together by a covalent bond, and carrying a negative electric charge. It is an important but usually minor constituent of water. It functions as a base, as a ligand, a nucleophile, and a...
ions, for example, when added to the solution, will react with free hydrogen ions and increase the pH of the solution. Additionally, hydroxide ions will abstract protons from carbonic acid
Carbonic acid
Carbonic acid is the inorganic compound with the formula H2CO3 . It is also a name sometimes given to solutions of carbon dioxide in water, because such solutions contain small amounts of H2CO3. Carbonic acid forms two kinds of salts, the carbonates and the bicarbonates...
in solution, causing the bicarbonate concentration to increase. The new position on the diagram following addition of hydroxide ions no longer lies on our original buffer line. However, if the PCO2 is now varied without further addition of strong acid or strong base to the solution, a new buffer line can be determined that lies above and approximately parallel to the original buffer line.
Similarly, in a physiologic system such as a living body, removal of protons, for example, by vomiting
Vomiting
Vomiting is the forceful expulsion of the contents of one's stomach through the mouth and sometimes the nose...
the acidic contents of the stomach
Stomach
The stomach is a muscular, hollow, dilated part of the alimentary canal which functions as an important organ of the digestive tract in some animals, including vertebrates, echinoderms, insects , and molluscs. It is involved in the second phase of digestion, following mastication .The stomach is...
, will result in an increase in pH and an increase in bicarbonate concentration, bringing the system to a new, higher buffer line. Such a disturbance is called a metabolic alkalosis (Fig. 12). Alternatively, if protons are added to the bloodstream in the form of acidic metabolites, as occurs during diabetic ketoacidosis
Diabetic ketoacidosis
Diabetic ketoacidosis is a potentially life-threatening complication in patients with diabetes mellitus. It happens predominantly in those with type 1 diabetes, but it can occur in those with type 2 diabetes under certain circumstances...
, then pH will fall, along with bicarbonate concentration. This type of disturbance is called a metabolic acidosis. In the case of metabolic acidosis, the new buffer line lies below the original line.